Posts

Showing posts from February, 2018

Angular Testing: routerLink

Today, I'll show you how you can test such a code: The routerLink directive on the anchor tag give the router control over this element. Find more info here . A. Provide the routerTestingModule with dummy routes as: B. Declare  Router and Location for use in your test: C. Routing is an asynchronous activity so we use one of the asynchronous testing methods at our disposal, in this case the fakeAsync method. Happy coding!!!
Angular Testing: ActivatedRoute

The route information and parameters are available through the ActivatedRoute service. While testing your components, it may be good to mock this service. 1. Mock ActivatedRoute If the user select an item within a list, the snapshot strategy can be used in your detail component. The route.snapshot provides the initial value of the route parameter map. The parameters can be accessed this way: The mocking service: 2. How to use? First we need to make available our ActivatedRouteStub in our test and pass testing parameters. So, in your test: 3. Mocking ActivatedRoute using a factory Using a factory is somewhat easier. In our component we have this code which we'd like to test: The test below uses a fake ActivatedRoute registered with the useFactory : Thanks

Rounded Percentages up to 100% using Insertion-Sort Algorithm

When you need to represent percentages as whole numbers using   Math.round() ,  you end up with a total of 101%.  Value Percentage Rounded A 650 49.88% 50 B 230 17.65% 18 C 150 11.51% 12 D 273 20.95% 21 1303 100.00% 101 As you can see above the total in the rounded column is 101. Let's solve this problem using a well known algorithm. Step 1: We begin to sum the given values for calculating the percentages. While iterating, we copy all the properties to a destination object ( NVPPercentage ) which will be pushed to an array ( temp ) . Step 2: The insertion sort, is an efficient algorithm for sorting a small number of elements. We start for each element to calculate the percentage ( P ) and the rounded percentage ( RP ). We sum also the rounded percentages (e.g. 101). We also compare in an inner loop the current element ( CE ) with the left ones for sorting purpose. While j is CE

Custom chart creation with canvas and Angular

Image
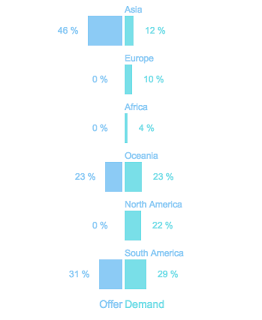
Today, I'd like to show you how you can create a reusable chart using canvas HTML element and Angular. We are going to develop the following component : As you can see we have two series of data. The component will be used as follow: <custom-chart [data]="datasets"></custom-chart> Let's first create the service to set up the canvas 2D context and draw our chart. Chart Service We are going to create a service to set up our environment and draw on the canvas.  The data format should be: Chart Component We access the canvas reference using the @ViewChild annotation. We will use @Input annotation for data binding. We can easily add more functionality to our component, but for demonstration purpose it's enough.

Chip input using Reactive Form

The Chips component documentation from the angular material website, describes how to use the MatChipInput directive with a chip-list for adding or removing chips. I'll show you how you can implement the same component using Reactive Form. The HTML template: The TS component file:   As you can see, we use the FormBuilder class to simplify the form creation. We define our requirements as a  FormArray within our FormGroup. The requirements will be accessed in our template with this expression inside the *ngFor of <mat-chip></mat-chip> : *ngFor="let requirement of form.get('requirements').controls; let i = index;" In the ChipComponent class, the requirements array is accessed by using this expression: this.form.get('requirements') as FormArray; Thanks