Custom chart creation with canvas and Angular
Today, I'd like to show you how you can create a reusable chart using canvas HTML element and Angular.
We are going to develop the following component :
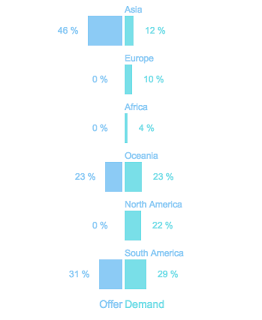
As you can see we have two series of data.
The component will be used as follow:
Let's first create the service to set up the canvas 2D context and draw our chart.
We can easily add more functionality to our component, but for demonstration purpose it's enough.
We are going to develop the following component :

As you can see we have two series of data.
The component will be used as follow:
<custom-chart [data]="datasets"></custom-chart>
Let's first create the service to set up the canvas 2D context and draw our chart.
Chart Service
We are going to create a service to set up our environment and draw on the canvas.
The data format should be:
Chart Component
We access the canvas reference using the @ViewChild annotation. We will use @Input annotation for data binding.
nemulocgu Judy Reuland https://wakelet.com/wake/PcK_xxUVVGJoqtjb__LVX
ReplyDeleteteaupetifens
clarorunpe1984 Shannon Baker SolidWorks
ReplyDeleteAutodesk Maya
McAfee Internet Security
bandmadmipha
Well Written Beautiful Post!
ReplyDeletehere is my post related to html canvas.
you may like.
Convert HTML to Canvas
NranisXclamya Keith Carouthers Click
ReplyDeletesoftware
essoifracal