Custom chart creation with canvas and Angular
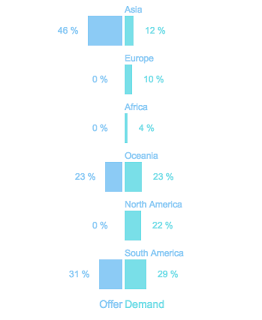
Today, I'd like to show you how you can create a reusable chart using canvas HTML element and Angular. We are going to develop the following component : As you can see we have two series of data. The component will be used as follow: <custom-chart [data]="datasets"></custom-chart> Let's first create the service to set up the canvas 2D context and draw our chart. Chart Service We are going to create a service to set up our environment and draw on the canvas. The data format should be: Chart Component We access the canvas reference using the @ViewChild annotation. We will use @Input annotation for data binding. We can easily add more functionality to our component, but for demonstration purpose it's enough.